How to change time and grid resolution in BattMo
Until now we have seen three different input types that can be used to define a simulation in BattMo:
CellParameters : defines the physical and chemical properties of the battery cell
CyclingProtocol : defines the current/voltage profile that the cell is subjected to during the simulation
ModelSettings : defines various settings for the battery model, such as which submodels to use
In addition to these, there is a fourth input type called SimulationSettings. These settings allow you to control the time step and grid resolution for your simulations. This can be useful for balancing accuracy and computational cost.
Let's see how to change these settings.
using BattMo, GLMakieLoad cell parameters as before
cell_parameters = load_cell_parameters(; from_default_set = "chen_2020")To demonstrate changing time resolution we will use a drive cycle to setup a current function.
Create wltp function to calculate Current (WLTP data from https://github.com/JRCSTU/wltp)
using CSV
using DataFrames
using Jutul

data_path = string(dirname(pathof(BattMo)), "/../examples/example_data/")
path = joinpath(data_path, "wltp.csv")

df = CSV.read(path, DataFrame)

t = df[:, 1]
P = df[:, 2]

power_func = get_1d_interpolator(t, P, cap_endpoints = false)


function current_function(time, voltage)

    factor = 4000 # Tot account for the fact that we're simulating a single cell instead of a battery pack

    return power_func(time) / voltage / factor
end

@eval Main const current_function = $current_function
current_function (generic function with 1 method)Load a cycling protocol that uses the current function
cycling_protocol = load_cycling_protocol(; from_default_set = "user_defined_current_function")Plot the drive data to see what we are simulating
fig = Figure(size = (1000, 400))
ax = Axis(fig[1, 1], title = "Drive cycle", xlabel = "Time / s", ylabel = "Power / W")
lines!(ax, t, P)
fig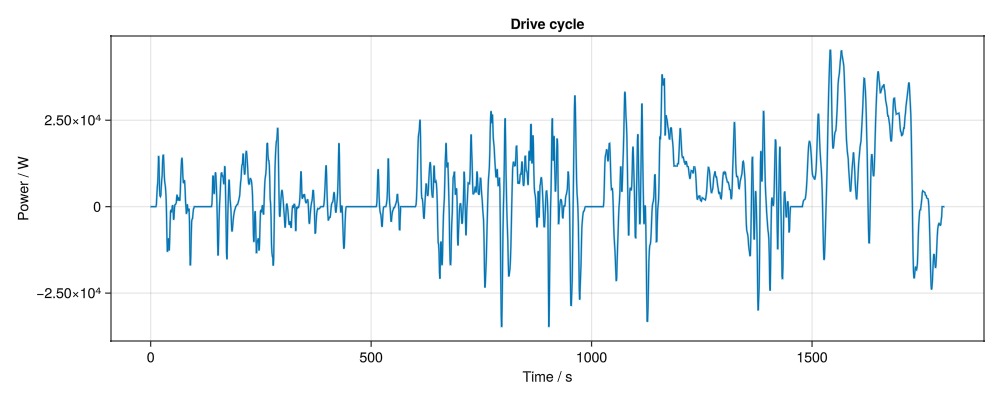
Load default simulation settings for the p2d model
simulation_settings = load_simulation_settings(; from_default_set = "p2d")run the simulation
model = LithiumIonBattery()
sim = Simulation(model, cell_parameters, cycling_protocol; simulation_settings)
output = solve(sim)
✔️ Validation of ModelSettings passed: No issues found.
──────────────────────────────────────────────────
✔️ Validation of CellParameters passed: No issues found.
──────────────────────────────────────────────────
✔️ Validation of CyclingProtocol passed: No issues found.
──────────────────────────────────────────────────
✔️ Validation of SimulationSettings passed: No issues found.
──────────────────────────────────────────────────
✔️ Validation of SolverSettings passed: No issues found.
──────────────────────────────────────────────────
Jutul: Simulating 30 minutes as 36 report steps
╭────────────────┬──────────┬──────────────┬──────────╮
│ Iteration type │ Avg/step │ Avg/ministep │ Total │
│ │ 36 steps │ 36 ministeps │ (wasted) │
├────────────────┼──────────┼──────────────┼──────────┤
│ Newton │ 3.25 │ 3.25 │ 117 (0) │
│ Linearization │ 4.25 │ 4.25 │ 153 (0) │
│ Linear solver │ 3.25 │ 3.25 │ 117 (0) │
│ Precond apply │ 0.0 │ 0.0 │ 0 (0) │
╰────────────────┴──────────┴──────────────┴──────────╯
╭───────────────┬──────────┬────────────┬──────────╮
│ Timing type │ Each │ Relative │ Total │
│ │ μs │ Percentage │ ms │
├───────────────┼──────────┼────────────┼──────────┤
│ Properties │ 155.9952 │ 15.80 % │ 18.2514 │
│ Equations │ 214.0508 │ 28.36 % │ 32.7498 │
│ Assembly │ 74.4156 │ 9.86 % │ 11.3856 │
│ Linear solve │ 257.0274 │ 26.04 % │ 30.0722 │
│ Linear setup │ 0.0000 │ 0.00 % │ 0.0000 │
│ Precond apply │ 0.0000 │ 0.00 % │ 0.0000 │
│ Update │ 52.4606 │ 5.31 % │ 6.1379 │
│ Convergence │ 78.0394 │ 10.34 % │ 11.9400 │
│ Input/Output │ 32.6274 │ 1.02 % │ 1.1746 │
│ Other │ 32.2546 │ 3.27 % │ 3.7738 │
├───────────────┼──────────┼────────────┼──────────┤
│ Total │ 987.0538 │ 100.00 % │ 115.4853 │
╰───────────────┴──────────┴────────────┴──────────╯Plot the results
plot_dashboard(output)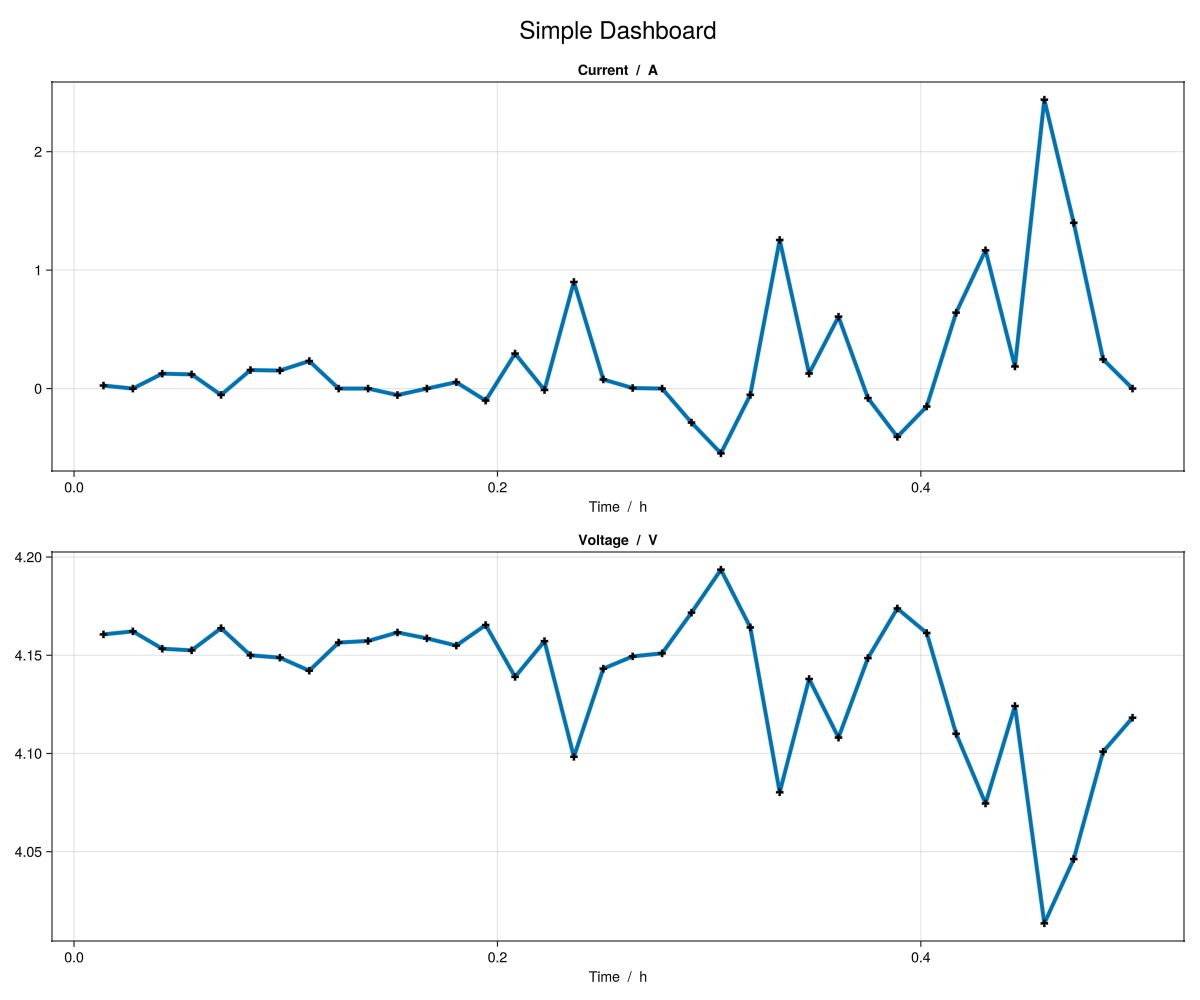
We can see from the plot that the time resolution is way too low to capture the dynamics of the drive cycle. We can change the time resolution by modifying the simulation settings. Let's see which simulation setting is available that has to do with time.
print_info("time"; view = "SimulationSettings")
----------------------------------------------------------------------------------------------------
◻️  Simulation Setting:  TimeStepDuration
----------------------------------------------------------------------------------------------------
    🔹 Name               TimeStepDuration
    🔹 Category           SimulationSettings
    🔹 Description        Duration of each time step in simulations
    🔹 Type               Real
    🔹 Unit               s
    🔹 Minimum value      1
    🔹 Maximum value      500
    🔹 Ontology link      ]8;;https://w3id.org/emmo/domain/electrochemistry#electrochemistry_85e39686_9658_4c74_bb91_a935704c174a\visit]8;;\

----------------------------------------------------------------------------------------------------
◻️  Simulation Setting:  RampUpTime
----------------------------------------------------------------------------------------------------
    🔹 Name               RampUpTime
    🔹 Category           SimulationSettings
    🔹 Description        Ramp up time duration applied to initialize the cell simulation.
    🔹 Type               Int64
    🔹 Unit               s
    🔹 Minimum value      0
    🔹 Maximum value      500

========================================================================================================================
We can see that the time step can be controlled by TimeStepDuration.
simulation_settings["TimeStepDuration"] = 1.0 # Set the initial time step duration to 1 second1.0Now let's rerun the simulation with the new time step duration and plot the results.
sim = Simulation(model, cell_parameters, cycling_protocol; simulation_settings)
output = solve(sim)
plot_dashboard(output)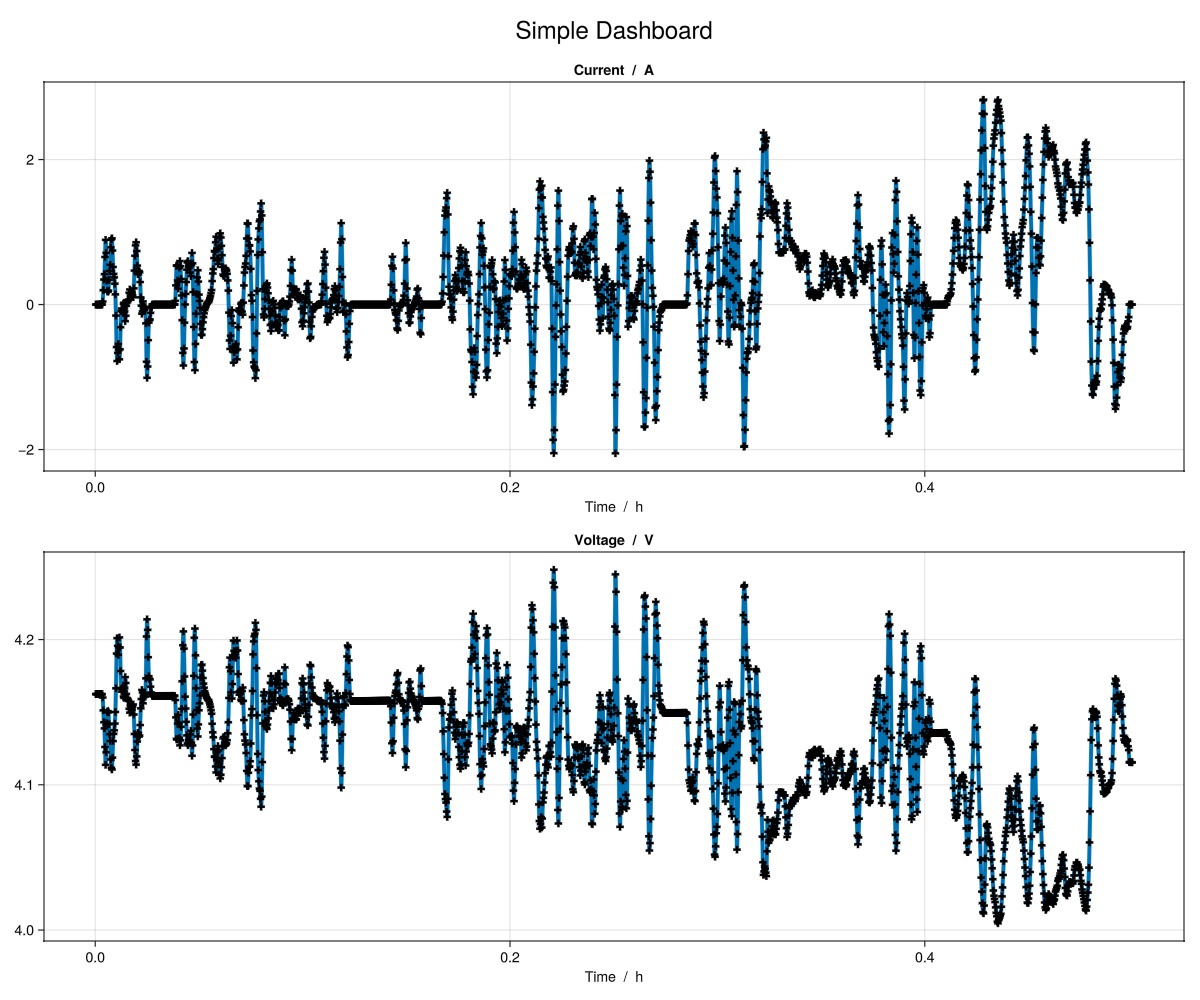
We can see that the time resolution is much better now and we can capture the dynamics of the drive cycle.
We can also plot the concentrations and potentials in the cell to see how they change over time and position. Let's plot them as line plots over position so we can have a look at the grid resolution.
plot_dashboard(output; plot_type = "line")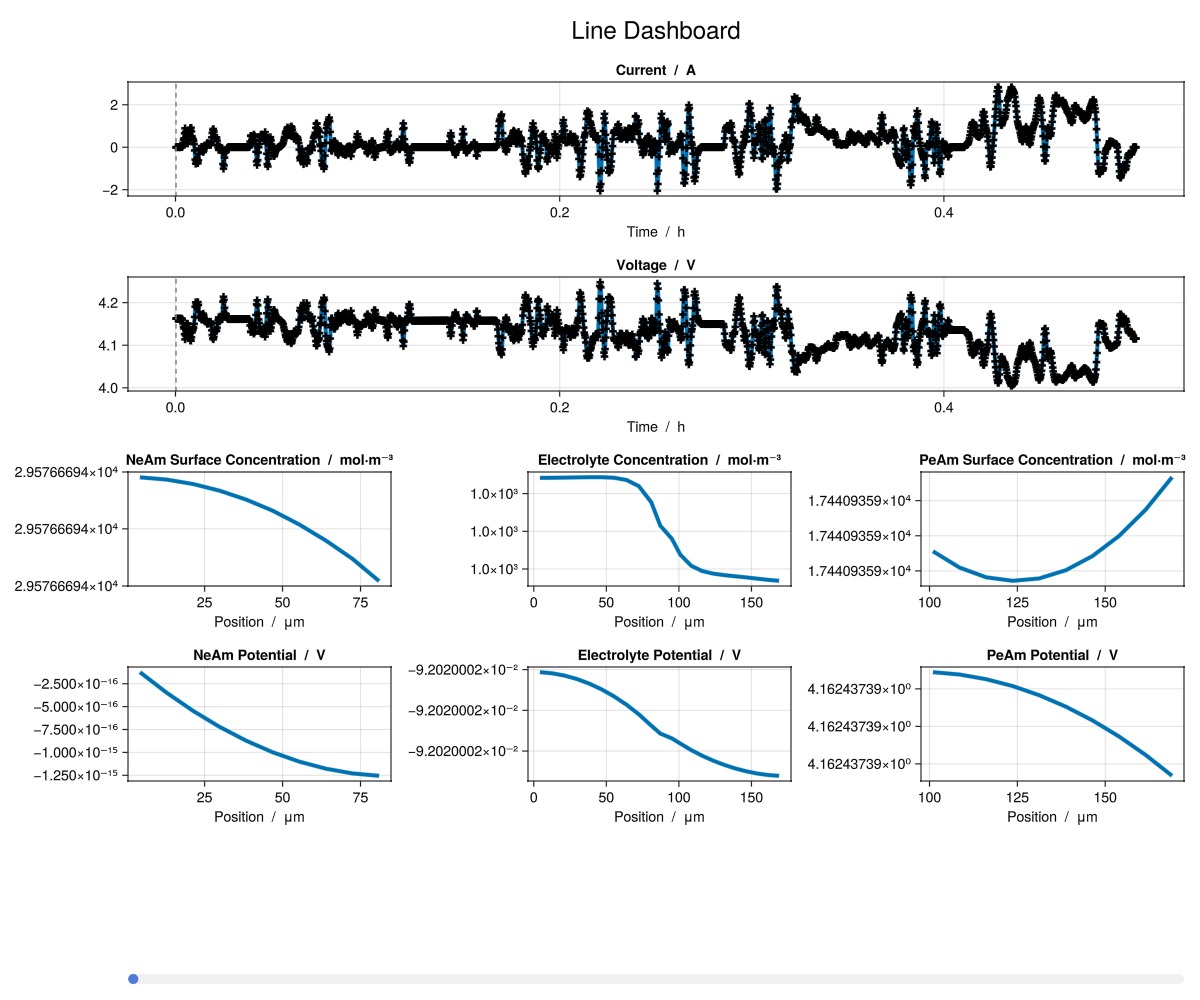
Now scrol the bar at the bottom of the window the change the time step to see how the concentrations and potentials change over time. For most time steps, we can see that the electrolyte concentration and positive electrode surface concentration over position are not smooth. This is because the grid resolution of the negative and positive electrode are too low to capture the concentration gradient. We can change the grid resolution by modifying the number of grid points in the simulation settings. Let's see which simulation setting is available that changes the negative and positive electrode coating thickness number of grid points.
print_info("PositiveElectrode"; view = "SimulationSettings")
----------------------------------------------------------------------------------------------------
◻️  Simulation Setting:  PositiveElectrodeCoatingGridPoints
----------------------------------------------------------------------------------------------------
    🔹 Name               PositiveElectrodeCoatingGridPoints
    🔹 Category           SimulationSettings
    🔹 Description        Number of grid points along the thickness dimension of the positive electrode.
    🔹 Type               Int64
    🔹 Minimum value      1
    🔹 Maximum value      1000

----------------------------------------------------------------------------------------------------
◻️  Simulation Setting:  PositiveElectrodeCurrentCollectorTabLengthGridPoints
----------------------------------------------------------------------------------------------------
    🔹 Name               PositiveElectrodeCurrentCollectorTabLengthGridPoints
    🔹 Category           SimulationSettings
    🔹 Description        In the current collector tab at the positive electrode, the number of grid points along the length dimension of the tab's face.
    🔹 Type               Int64
    🔹 Minimum value      1
    🔹 Maximum value      1000
    🔹 Ontology link      ]8;;https://w3id.org/emmo/domain/electrochemistry#electrochemistry_47608fd0_cc0d_457e_9141_051935029e3a\visit]8;;\

----------------------------------------------------------------------------------------------------
◻️  Simulation Setting:  PositiveElectrodeParticleGridPoints
----------------------------------------------------------------------------------------------------
    🔹 Name               PositiveElectrodeParticleGridPoints
    🔹 Category           SimulationSettings
    🔹 Description        Number of grid points along the radial pseudo dimension of the positive electrode active material particles.
    🔹 Type               Int64
    🔹 Minimum value      1
    🔹 Maximum value      1000

----------------------------------------------------------------------------------------------------
◻️  Simulation Setting:  PositiveElectrodeCurrentCollectorTabWidthGridPoints
----------------------------------------------------------------------------------------------------
    🔹 Name               PositiveElectrodeCurrentCollectorTabWidthGridPoints
    🔹 Category           SimulationSettings
    🔹 Description        In the current collector tab at the positive electrode, the number of grid points along the width dimension of the tab's face.
    🔹 Type               Int64
    🔹 Minimum value      1
    🔹 Maximum value      1000

----------------------------------------------------------------------------------------------------
◻️  Simulation Setting:  PositiveElectrodeCurrentCollectorGridPoints
----------------------------------------------------------------------------------------------------
    🔹 Name               PositiveElectrodeCurrentCollectorGridPoints
    🔹 Category           SimulationSettings
    🔹 Description        Number of grid points along the thickness dimension of the positive electrode current collector.
    🔹 Type               Int64
    🔹 Minimum value      1
    🔹 Maximum value      1000

========================================================================================================================
And the negative electrode grid resolution.
print_info("NegativeElectrode"; view = "SimulationSettings")
----------------------------------------------------------------------------------------------------
◻️  Simulation Setting:  NegativeElectrodeCurrentCollectorTabWidthGridPoints
----------------------------------------------------------------------------------------------------
    🔹 Name               NegativeElectrodeCurrentCollectorTabWidthGridPoints
    🔹 Category           SimulationSettings
    🔹 Description        In the current collector tab at the negative electrode, the number of grid points along the width dimension of the tab's face.
    🔹 Type               Int64
    🔹 Minimum value      1
    🔹 Maximum value      1000
    🔹 Ontology link      ]8;;https://w3id.org/emmo/domain/electrochemistry#electrochemistry_47608fd0_cc0d_457e_9141_051935029e3a\visit]8;;\

----------------------------------------------------------------------------------------------------
◻️  Simulation Setting:  NegativeElectrodeCurrentCollectorTabLengthGridPoints
----------------------------------------------------------------------------------------------------
    🔹 Name               NegativeElectrodeCurrentCollectorTabLengthGridPoints
    🔹 Category           SimulationSettings
    🔹 Description        In the current collector tab at the negative electrode, the number of grid points along the length dimension of the tab's face.
    🔹 Type               Int64
    🔹 Minimum value      1
    🔹 Maximum value      1000
    🔹 Ontology link      ]8;;https://w3id.org/emmo/domain/electrochemistry#electrochemistry_47608fd0_cc0d_457e_9141_051935029e3a\visit]8;;\

----------------------------------------------------------------------------------------------------
◻️  Simulation Setting:  NegativeElectrodeCoatingGridPoints
----------------------------------------------------------------------------------------------------
    🔹 Name               NegativeElectrodeCoatingGridPoints
    🔹 Category           SimulationSettings
    🔹 Description        Number of grid points along the thickness dimension of the negative electrode.
    🔹 Type               Int64
    🔹 Minimum value      1
    🔹 Maximum value      1000

----------------------------------------------------------------------------------------------------
◻️  Simulation Setting:  NegativeElectrodeCurrentCollectorGridPoints
----------------------------------------------------------------------------------------------------
    🔹 Name               NegativeElectrodeCurrentCollectorGridPoints
    🔹 Category           SimulationSettings
    🔹 Description        Number of grid points along the thickness dimension of the negative electrode current collector.
    🔹 Type               Int64
    🔹 Minimum value      1
    🔹 Maximum value      1000
    🔹 Ontology link      ]8;;https://w3id.org/emmo/domain/electrochemistry#electrochemistry_47608fd0_cc0d_457e_9141_051935029e3a\visit]8;;\

----------------------------------------------------------------------------------------------------
◻️  Simulation Setting:  NegativeElectrodeParticleGridPoints
----------------------------------------------------------------------------------------------------
    🔹 Name               NegativeElectrodeParticleGridPoints
    🔹 Category           SimulationSettings
    🔹 Description        Number of grid points along the radial pseudo dimension of the negative electrode active material particles.
    🔹 Type               Int64
    🔹 Minimum value      1
    🔹 Maximum value      1000
    🔹 Ontology link      ]8;;https://w3id.org/emmo/domain/electrochemistry#electrochemistry_47608fd0_cc0d_457e_9141_051935029e3a\visit]8;;\

========================================================================================================================
We can see that the grid resolutions can be controlled by PositiveElectrodeCoatingGridPoints and NegativeElectrodeCoatingGridPoints.
Lets have a look at the current number of grid points and increase them.
println(
    "Current grid resolution in positive electrode coating and separator: ",
    simulation_settings["PositiveElectrodeCoatingGridPoints"],
    " and ",
    simulation_settings["NegativeElectrodeCoatingGridPoints"],
)

simulation_settings["PositiveElectrodeCoatingGridPoints"] = 20 # Increase the number of grid points in the positive electrode coating to 20
simulation_settings["NegativeElectrodeCoatingGridPoints"] = 20 # Increase the number of grid points in the separator to 10

#Let's rerun the simulation with the new grid resolution and plot the results.
sim = Simulation(model, cell_parameters, cycling_protocol; simulation_settings)
output = solve(sim)
plot_dashboard(output; plot_type = "line")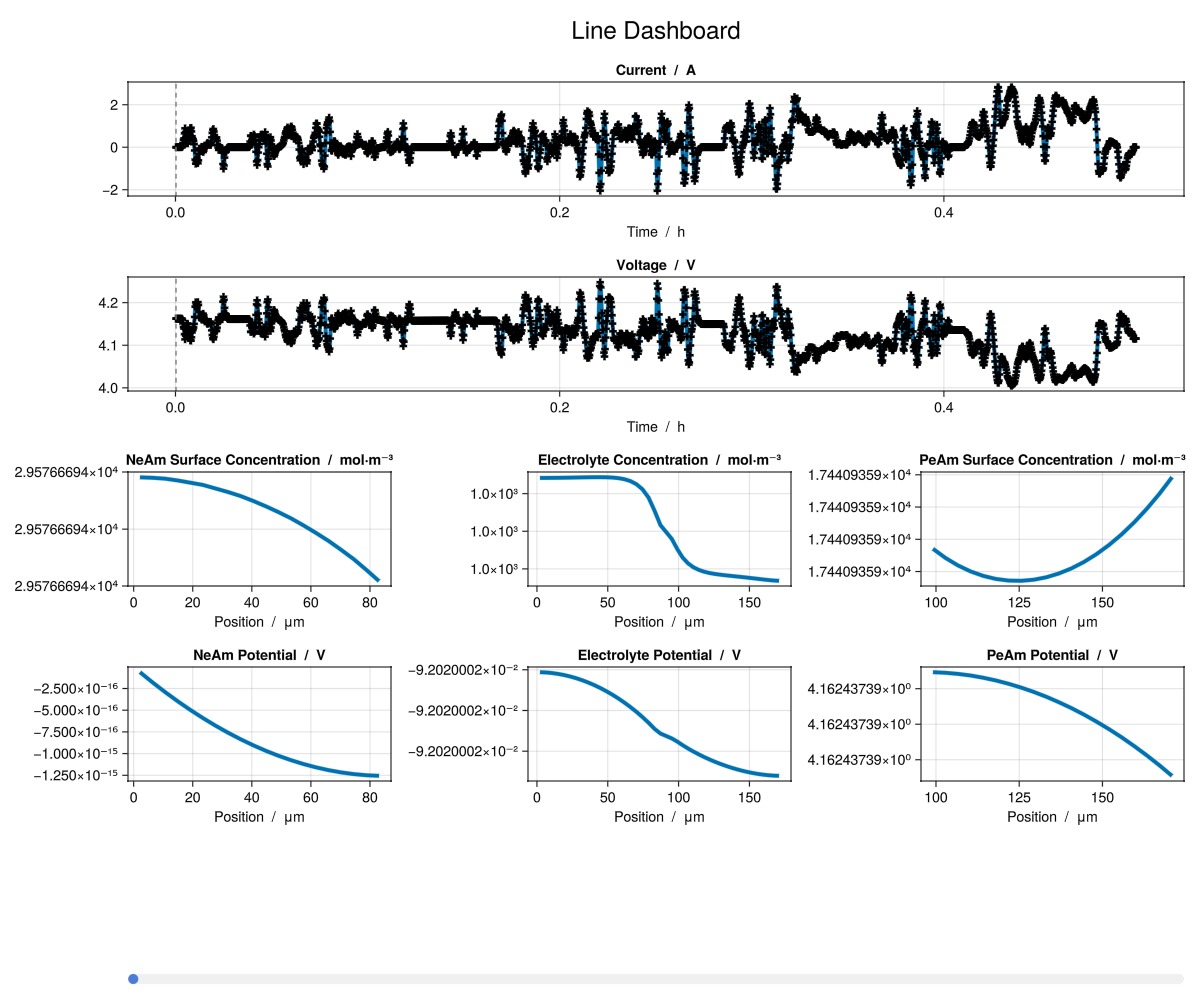
We can see that the electrolyte concentration and positive electrode surface concentration over position are now smooth.
Example on GitHub
If you would like to run this example yourself, it can be downloaded from the BattMo.jl GitHub repository as a script.
This page was generated using Literate.jl.